|
Henry R. Vaillancourt MD MPH FAAFP
|
|
The CDC, by means of its publication MMWR (Morbidity & Mortality Weekly Report), just released data on the first 30 days of vaccine safety monitoring of the two presently available vaccines (Pfizer’s and Moderna’s) for COVID-19. The information came from two sources: VAERS (Vaccine Adverse Event Reporting System) and V-safe. VAERS is a national vaccine surveillance system that accepts reports of potential adverse events due to a vaccine from health care providers, vaccine manufacturers and the public. Serious events are followed up by the program and usually entail a review of medical records, reports from healthcare providers and evaluation of any other materials. V-safe is a special, voluntary reporting system that the CDC established for people who have received a COVID-19 vaccine. participants take a daily survey on their smartphone for the first week after vaccination. If they had to seek medical care, they are contacted and a VAERS report is filed. Although the reporting systems are not comprehensive, they do give a reasonable amount of information for analysis.
Why are we looking at this information? It is important to see how published studies can be misinterpreted and used to justify conclusions that are absolutely wrong. When you look at the CDC report, it is important to realize that you are only looking at accounts of events reported to VAERS and V-safe, and many, if not most of these occurrences, have already been reported in the clinical studies where their incidence was compared to those events in a group of people who received a placebo and not the vaccine. Without knowledge of this comparison, and only the information found in VAERS and V-safe, one could erroneously conclude that the vaccines lead to significant serious adverse events. Consequently, I am sure that there will likely be a few media postings that will misinterpret the CDC’s report. Between mid-December and mid-January, close to 14,000,000 doses of the vaccines were given. The first encouraging set of results is that the total number of reported adverse events, as a reflection of the number of doses given, was only 6,994, or a 0.05% incidence. Of the number of adverse events reported, ~91% were not considered serious and only 9% were considered serious. The vast majority of the non-serious symptoms had also been noted in the clinical trials - such as headache, fatigue, muscle and joint aches, fever and chills which all occurred within a day of each shot and were very short-lived. Of the 640 serious events reported, 113 were deaths and 527 were other conditions. It is to be noted that VAERS and V-safe define a “serious adverse event” as one of the following: death, life-threatening illness, hospitalization or prolongation of hospitalization, etc. If we look at both the Moderna and the Pfizer study two things are apparent: 1. Serious adverse events were practically no different in the vaccine vs. the placebo groups; 2. If we look at the clinical study results and apply the percentage of serious adverse events to the number of doses the VAERS and V-safe data encompass, the outcome is that significantly far fewer serious events have been reported during the vaccine implementation phase versus the study phase. Again, just looking at the CDC report and not at any of the clinical trials data gives a totally skewed impression of the safety of these vaccines. The press has already reported on the number of deaths noted in the CDC report, but neglects to say that in the Pfizer clinical trials there were 2 deaths in vaccine recipients and 4 deaths in the placebo recipients’ group; in Moderna’s clinical trials there was 1 death in a vaccine recipient and 2 deaths in a the placebo recipient’s group. In both cases these were well within the expected number of deaths occuring over that time in the general population. If we look at the CDC report from a different perspective and do a proportion of the number of doses administered and deaths within the following 1 month this figure shows a death incidence of only 0.0000819%. Again, looking just at VAERS and V-safe numbers a very different, erroneous impression can occur. Normally, the number of deaths in the U.S. is ~776 per million people during each of the months of December and January. Based upon this, the number of reported deaths in vaccine recipients appears to be far below the expected number in the general population during those months. Another important point is that of these 113 observed deaths, just under two thirds occurred in people who resided in a long-term care facilities (LTCF) - one half of these occurred in residents who were in hospice care or had a “do-not-resuscitate” status. Another one quarter of those LTCF residents who died after vaccination had heart disease, dementia, pneumonia, or failure to thrive listed as causes of death. One final point is that those fatalities that were reported in people who were not living LTCF, a little less than half of were found to be in people who had underlying cancers, heart disease, strokes, pulmonary problems, or frail health – all predisposing causes to a sudden death. So, I would have to say that the presently reported data does not support a causal relationship of vaccination with a subsequent demise, since the numbers are still far below what is expected in the non-vaccine recipient population. The other important observation from the data is that the risk of anaphylaxis (a serious allergic reaction) is not at all out of the range that one would expect with any vaccine. It was reported as 4.5 incidents per million doses; for instance, as reported by the CDC, the anaphylaxis rate with Influenza vaccine is 1.4 per million doses administered; with the pneumonia vaccine 2.5 per million; and with the shingles vaccine 9.6 per million doses administered. We know, from the clinical studies, that the most commonly reported side effects are injection site pain (~75+%), fatigue (16.5%), headache (22.4+%), muscle aches (~30%) and chills-(~20+%) - more commonly seen the day after vaccination, short-lived and more likely after the second dose. Fever and chills were more often reported after the second Pfizer dose than after the first, and this, too is the case with Moderna’s vaccine. The CDC report bears this out and none of the side effects are of a greater magnitude than seen in the studies. So, what does this CDC report tell us then? Most of the reactions are non-serious and reports of serious events appear to be consistent with what was seen in the placebo group of the studies. Will this data change as we continue to monitor and observe those who have received the vaccine? It could, particularly as newer vaccines are added. However, we now have one month’s worth of data for vaccines that have been given under “everyday” conditions and not under the strict conditions of a rigorously controlled clinical study…. and they look very good. Waiting and watching for additional information is not worth the risk of contracting COVID-19. Do the math; there were only ~6,350 non-serious adverse events after ~13,800,000 vaccinations and only 640 serious adverse events after ~13,800,000 vaccinations! Remember, “The best vaccine to get is the one you can get now, not the one you wait for later!”
0 Comments
The short answer: “The one you can get tomorrow, not weeks from now.” The SARS CoV-2 virus (commonly called COVID-19) is a coronavirus that is sphere-shaped, contains only ribonucleic acid (RNA) and is covered by spikes that resemble a “corona” (Spanish for crown). These spikes consist of three protein strands that wrap around each other and end in a slightly flattened ball shape. Picture a tree made of three intertwined trunks ending in a large canopy. The spikes help the virus attach to and enter into cells where it replicates. Our immune system responds by making antibodies and priming other immune system cells to destroy invading viral cells. RNA viruses employ a clever survival tactic – they reproduce very quickly but lacking the “mistake-correcting” machinery of DNA viruses, they are prone to errors when replicating. Errors increase the likelihood of mutations, which can sometimes present an advantage for a virus. A mutation or “variation” can make the virus more infectious, more lethal, or more resistant to responses from the body’s immune system. This is why it is so important to limit the spread of the COVID-19 virus so as to lessen the chances that new mutations will arise as it spreads from person to person. Vaccine developers must take all of this into account. . A dramatic battle at the cellular level Viruses are intent on invading the body’s cells, taking over their machinery and reproducing. While invading COVID-19 viruses may remain attached to the exterior of the human cells that they target, they aim to penetrate the cells to replicate by the thousands. Overloaded cells then break open and release the thousands of copies into the bloodstream. Broadly, vaccines work by “priming” and activating the immune system to make antibodies and other immune cells that attack, in this case, the virus’ spike protein. This is currently achieved (depending on the vaccine) in one or two doses. It is the immune system that actually kills invading viruses by generating antibodies, memory cells, helper cells and other defenders. Note that virus mutations or variants can affect the immune system’s effectiveness. Thankfully, none of the variants identified to date have fully eluded the “primed” immune system that results from the current vaccines. Because of its fragility and short life span, messenger RNA vaccines must be kept frozen and handled carefully; hence the special storage and transport requirements of the Pfizer and Moderna vaccines. Vaccines activate the body’s natural defense system in a number of different ways. Vaccine type one. Pfizer and Moderna created vaccines built on a “messenger RNA platform.” Their vaccines consist of a small strand of artificially produced messenger RNA that is coded for COVID-19’s spike protein and is encased by fatty acid globules. The globules enhance the ability of the messenger RNA strands to get into human muscle cells (where the injection is given). Once in, the messenger RNA is unsheathed, and the protein-producing machinery of the cell takes it up. Copies of the spike protein are made by the thousands. After a very short time, the messenger RNA in the cell breaks down since it is so fragile. The newly made spikes are then released where the immune system now “sees” them and responds. The messenger RNA never enters the nucleus of the cell where DNA resides and is not incorporated into the DNA of the cell. Vaccine type two. Some vaccine developers have inserted a spike protein gene onto the DNA of a virus and also modified the virus so that only the spike protein can be made, and not the virus that carries it. When the virus enters a host cell, it releases its DNA, which then travels to the cell’s nucleus. From there, messenger RNA is made from the viable/readable strand of DNA that contains the instructions for making a spike protein. The messenger RNA leaves the nucleus and enters the protein-producing factories of the cell with the same result as seen with the messenger RNA vaccines. The virus’ DNA is not incorporated into the human cell’s DNA; it breaks down and when the infected cell breaks open to release virus spikes, it is destroyed. Examples of this type of vaccine come from Johnson & Johnson’s, AstraZeneca/Oxford as well as from Russian and Chinese companies. Vaccine type three. The third major strategy for activating the immune system to recognize and attack Covid-19’s spike protein is to create a vaccine made of purified virus spikes. This is done by placing spike-producing genes inside yeast or other cells that then produce copies of the spike protein which are then harvested and purified to make a vaccine. The purified spike proteins are then injected into the body. Novavax has been working on this type of vaccine. One dose, two doses? One or two is a matter of achieving the highest effectiveness of the type of vaccine approach taken. Testing on the first vaccines from Pfizer and Moderna proved that two doses achieved efficacies in the 95% range. This then brings us to an important point. Both the Pfizer and Moderna vaccines were tested earlier on than have the Johnson & Johnson and Novavax vaccines. So, it is difficult to compare efficacies when the two soon-to-be released vaccines are compared to the present ones. Both have been reported to have efficacies less than the 90-95% found for the Pfizer and Moderna vaccines. However, neither the Moderna nor Pfizer were initially tested against the more infectious variants. The important point to bear in mind is that all these vaccines have been found to prevent severe COVID-19 disease (the main reason for hospitalization) and deaths. This applies even when tested against the present “variants/mutations.” So, we really should not be comparing “efficacies” so much as the ability to prevent severe disease, hospitalizations, and death. From this point of view, they all seem to accomplish this goal. So, which vaccine is best? All of the major vaccines have proven to prevent severe disease, hospitalizations and death. They are mainly differentiated by their varying degrees of effectiveness against mild disease. Faced with the risk of getting sick unvaccinated, I recommend rolling up your sleeve and getting whichever one you can get as soon as it is possible and do not worry about one or two shots, or this brand or that one! Afterword: If we can convert COVID-19 from a virus that results in severe disease with hospitalizations and deaths into (in the words one researcher) a “nuisance virus;” then science will have accomplished its goal. The likelihood of eliminating COVID-19 from the face of the earth may be a bit too lofty; but with effective vaccines in our toolbox, we can accomplish just as much. Remember the Flu?
Why bring up influenza when we are amid a pandemic? Among the reasons is the potential seriousness of this seasonal viral infection – something that is easy to forget when COVID-19 is grabbing all the headlines. The Center for Disease Control reported an estimated 38 million cases during the 2019-2020 flu season resulting in 22,000 deaths. The CDC believes the reported 188 pediatric deaths in fact numbered at least 434. There were also ~400,000 flu-related hospitalizations, including pregnant women who are at an increased risk for flu-related hospitalization and complications. While COVID-19 currently accounts for approximately 10,474,012 cases and 244,421 deaths, the flu should not be taken lightly – and it’s preventable. Flu shot benefits and effectiveness Generally, seasonal vaccines are about 40-60% effective when they match the circulating strains. Last year’s shot was only about 39% effective thanks to a vaccine/flu strain mismatch as the Influenza B strain struck first, followed in January by Influenza A. (Learn more about flu strains on our blog: “Flu Facts and Symptoms.”) The 2018-2019 vaccine was more effective, preventing ~4.4 million influenza illnesses, ~2.3 million medical visits, ~58,000 hospitalizations, and ~3,500 deaths. (Learn more about the benefits of vaccination on the CDC’s ”Key Facts About Seasonal Flu Vaccine” page.) Is it flu or is it COVID? Minus testing, there are no definite symptoms to distinguish between a case of the flu and a COVID-19 infection – although some clues such as loss/alteration in taste or smell point to the latter. If you’re feeling off, the best course of action is to get tested for both. Yes, both because there is a possibility of having both at the same time. Get a flu shot; here’s why. You’ll protect yourself and those around you, and you’ll help relieve the burden on the medical system. Now let me separate fact from fiction: With the multitude of vaccine forms available today, the possibility of triggering an allergic reaction is simply not a serious problem. You may have heard that you can get the flu from a flu shot. This is an urban legend. It persists despite no scientific evidence. In fact, all the vaccine forms except one contain no live, able-to-infect influenza virus. The only live form is one given intranasally as a weakened live vaccine that is not able to reproduce outside of the nose. Your immune system naturally reacts to any foreign substance, including a vaccine. So if you feel achiness, low-grade fever, fatigue or discomfort after a flu shot, you’re not experiencing the flu, but rather a functioning immune system working as it should. Recent social media posts have spread another fiction. Often citing a 2012 study, the posters claim that flu shots increase the risk of contracting or developing a serious case of COVID-19. Not true! That study is irrelevant since the 2012 flu strain and vaccine was different then, and obviously COVID-19 did not even exist until 2019. Similar claims based on another study published in January 2020 are just as wrong. The study’s author spoke out to debunk the falsehoods stating, “The results of this study cannot and should not be interpreted to represent any sort of relationship or association of influenza vaccination receipt and COVID-19 illness.” A number of recent studies, particularly one from the Cleveland Clinic, show no relationship between getting a flu shot and developing COVID-19. Bottom line: if you are six months of age or older, get your flu shot! Some disturbing postings on social media have occurred lately. They have implied or outright stated that Flu shots may increase one’s risk of contracting COVID-19 or increase the likelihood of having a severe case if one does develop such an infection.
One such posting, and likely reposted by many, referred to two studies: one published in 2012 and the other this past January. It is worthwhile to quickly review these from an epidemiologist’s point of view to show why their conclusions cannot be used to extrapolate to the effect of Flu shots upon the risk of contracting COVID-19. Also, it is worth presenting several subsequent studies and reviews that will allay this concern. The 2012 study (Increased risk of noninfluenza respiratory virus infections associated with receipt of inactivated influenza vaccine) looked at 115 children (69 vaccinated, and 46 not vaccinated). They ranged in age from 6-15 years old. The vaccine used (a trivalent inactivated influenza vaccine) is not the one currently used. They found a subsequent increased risk of non-influenza viral infections in children who received the shot. Coronaviruses were listed as one of the types found but they accounted for only a small portion of the non-influenza viruses evaluated, and, most important of all were very different from the coronavirus causing COVID-19 . Upon reviewing their data, the possibility of an association is not statistically significant- in other words the same finding could have happened by chance alone and not due to any cause and effect! Even if there had been an association found, the fact that the study had so few participants would make the findings weak. Also, for numerous reasons, conclusions from studies in children are often not generalizable to the adult population. The other often-quoted study, published this past January (Influenza vaccination and respiratory virus interference among Department of Defense personnel during the 2017–2018 influenza season), looked at ~9,000 people, predominantly male, active duty service members between the ages of 18-35 years old. Some of their data has been used to show that inactivated influenza vaccine increases the risk of a coronavirus infection. The author of the study (Dr. Wolff) was disturbed enough by this misuse/misinterpretation of his data that he wrote a letter, this past June, to the Editor of Vaccine ,which published his study, stating the following: “…..the results of this study cannot and should not be interpreted to represent any sort of relationship or association of influenza vaccination receipt and COVID-19 illness. Results from this study DO NOT support the anti-vaccination viewpoint of avoiding seasonal influenza vaccination, and in fact should be interpreted in the opposite manner, since significant protection against influenza was associated with vaccination receipt, and a slight decrease in the odds of infection from other respiratory viruses was also noted. Results from this study should not be applied to or interpreted with COVID-19 in any way.” Unfortunately, there were problems in the method used to account for the results- particularly as pertains to coronaviruses. Based upon “corrected” statistical methods of data analysis, as suggested by other researchers, the findings do not really show any statistically increased risk of coronavirus-positive infections. A paper published at the end of this May ( Influenza Vaccine Does Not Increase the Risk of Coronavirus or Other Noninfluenza Respiratory Viruses: Retrospective Analysis From Canada, 2010–2011 to 2016–2017 ), looking at nearly 11,000 Canadians seen by their primary care physicians, concluded that influenza vaccination had no effect upon coronaviruses or other non-influenza viruses in so far as increased or decreased risk of infection by them. A preprint paper published online this September 3 (Could seasonal influenza vaccination influence COVID-19 risk?), looked through the medical literature and identified and analyzed 18 studies. To summarize their conclusions, it appears that the probability of an influenza vaccine causing an increased risk of a non-influenza respiratory infection is neither more nor less likely. The findings were weak for either conclusion. They did recommend that further studies be done. However, it is important to note that some of the papers reviewed were not necessarily looking at COVID-19 but, rather, at a large number of non-influenza viruses, and that close to half of the studies they reviewed involved children. Finally, a recent Cleveland Clinic study (Safety of Influenza Vaccine during COVID-19) pre-published this September, looked at over 18,000 patients from this past influenza season (Fall of 2019-Winter of 2020) and compared those who received to those who didn’t receive an influenza vaccine. They found that influenza vaccination was not related to an increased incidence of COVID-19, nor did it result in an increased risk of hospitalization, ICU admission or in-hospital mortality in those who developed COVID-19. Consequently, in contrast to what social media may be saying, getting a Flu shot does not appear to increase your risk of contracting COVID-19 or to increase its severity or complications. So, get your flu shot! There is also some evidence that a flu shot may be beneficial above and beyond just preventing influenza- but that was the subject of another blog. Part 1: Types of Tests
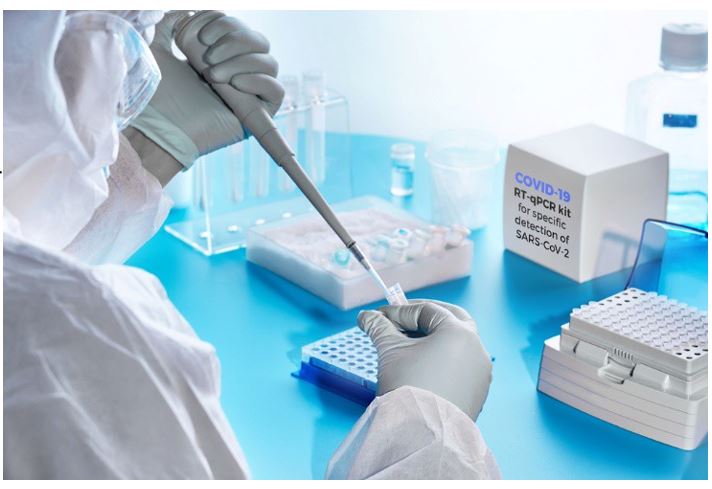
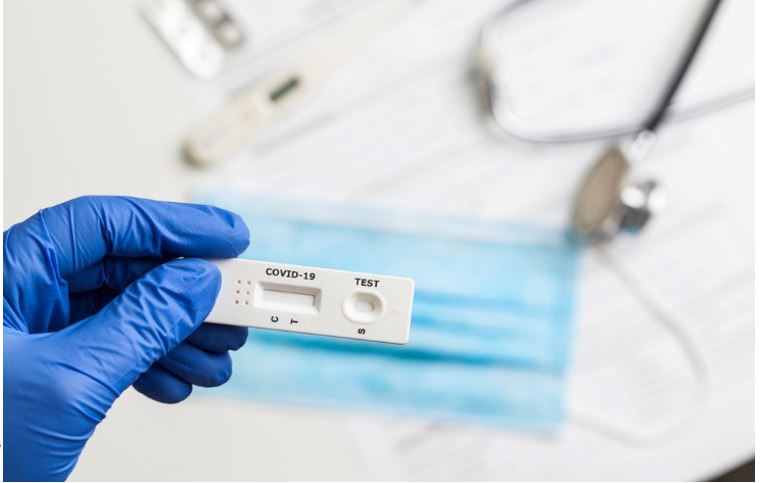
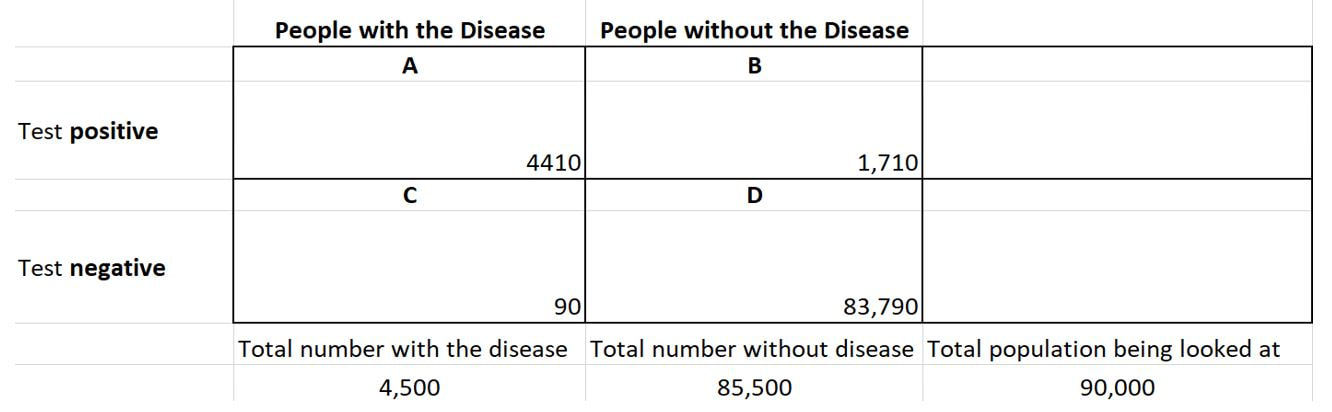
I’d like to discuss the two types of tests available for SARS-CoV-2 (the agent causing a COVID-19 infection) and their usefulness. In Part II, I’ll discuss the significant limitations of the antibody test. The Reverse-transcriptase Polymerase Chain Reaction (RT-PCR) Test Often referred to simply as PCR, this is the most used and most reliable test for diagnosis. Without going into detail, this test detects and amplifies viral RNA through molecular techniques (replication cycles). The fewer the replication cycles needed to detect the RNA, the higher the viral RNA loads (amount of RNA present in the specimen, commonly referred to as titers). A positive result reflects the presence of viral RNA, but not necessarily infectious or viable virus. Coupled with illness symptoms, a recent exposure, or a strong suspicion, a positive test indicates an active infection. Depending upon the source of the test specimen, the RT-PCR can be positive for several days before the onset of symptoms to as long as several weeks after the onset of symptoms – although the titers may be much lower. One potential issue is that in some cases, non-infectious viral RNA, rather than infectious viral particles can sometimes be detected after a negative test result. This can occur as parts of the virus that contain RNA are being shed. Someone whose tests were negative after they improved, and then had positive PCRs have not been shown to infect others. Initially, it was thought that these people were suffering a recurrence of the infection. It looks as if that is not the case. There is a possibility of false negatives due to the timing of the sample in relation to the illness, the source used and sample collection errors/sample handling errors. In fact, some clinicians have reported false negative rates of anywhere from 2% to 30%, depending on where the sample is collected (nasopharynx, mouth, lung washings) and the means used to collect the sample. On the day symptoms first appear, the median false negative rate may be upwards of 38%. It may drop to 20% on the third day after symptom onset, and then climb to 66% two or more weeks later. Conversely, a false positive test is extremely unlikely since the RT-PCR test looks for specific sites unique to SARS-Cov-2 RNA. Antibody tests These tests detect the presence of IgM and IgG antibodies. SARS-Cov-2 antibody tests were initially anticipated to be “game changers.” Their promise has waned due to the limitations discussed here and in Part 2. It’s important to understand that SARS- CoV-2 is just one of several viruses in the coronavirus family. These tests are less complex than the RT-PCR. They detect the presence of virus-fighting antibodies that are produced by an infected person’s immune system. The immune system first produces the IgM antibody, which peaks and then declines, followed by IgG, which usually appears after a few weeks and persists for much longer. Traditionally, the presence of IgM antibodies signifies an acute infection, while the presence of IgG indicates a resolving or prior infection. However, in the real world, it is not that simple. People infected with SARS-CoV-2 make both IgM and IgG within the first week or so with highest levels occurring in the second and third weeks of illness. By the seventh week, IGM levels are extremely low to zero while IgG levels persist – but we really do not know for how long. As it turns out, our immune system produces antibodies that target several components of the SARS-CoV-2 virus. Antibodies are like a key that fits a specific lock – in this case, a particular portion of the virus. Thus, depending on which specific components of the virus the antibodies will attack, they differ. So, a test that has been designed to look for one type of antibody, could “miss the mark” even though there are other antibodies against the virus in the test specimen. Also, since there are four coronaviruses that account for approximately 30% of what we call the “common cold,” an antibody test that looks for antibodies against a component shared by other coronaviruses may be picking up a previous non-SARS-CoV-2 infection. So, unless the antibody test was specifically designed to pick up antibodies to unique components of SARS-CoV-2, the result may be misleading. As it is, the various manufacturers have not fully disclosed which components of coronaviruses that the antibodies their test has been designed to identify are targeting. Thus, we can see the potential for a positive test not really being indicative of an infection with SARS-CoV-2 versus a “coronavirus.” The two antibody tests One can be done in a doctor’s office and one requires a laboratory. Some tests measure total antibody (both IgM and IgG), some measure just IgG, and some measure both IgM and IgG separately. The office-based tests use a lateral flow technique where a medical professional flows a test sample across a strip impregnated with an indicator. The result is either positive or none. This test is in a class called a qualitative or response/no response test. A great example is a home pregnancy test where a control line shows up (the control) and then another line shows up if the pregnancy test is positive. These tests are simple to perform but lack some of the precision of the quantitative tests. The lab variety is a quantitative test. The most common type is an ELISA (enzyme-linked immunosorbent assay). This test gives an actual titer or amount of the antibody present. With proper validation, a cut-off can be assigned where if the titer is below this level it is considered negative and positive if above. However, the best way to report it is giving an actual titer with comments as to “above what” might be considered “protective”. There are a number of ELISAs. Some measure just IgG and some measure both types of antibodies (IgM and IgG). These complex tests require the skills of a laboratory staff. Theoretically, a quantitative titer can be linked to degree of protection while a qualitative test result can only be loosely associated with protection. In Part II, I will discuss what an antibody test can actually reveal as well as the pitfalls of reading too much into the results.
What is the new “norm” going to look like? When can we expect it? These are good questions that do not have clear or precise answers. Clearly, as of 4-9-2020, we have not yet reached the peak in cases in Massachusetts or Rhode Island. But, even when we do reach the peak and begin the downward decline, things will never really return to what we used to consider “normal”. Why? Well, there are a number of reasons. The first has to do with the question of how we can expect the SARS-CoV-2 virus to behave. Much hope has been placed on the fact that Influenza and other Coronaviruses seem to “disappear” in the warm weather – and return in the fall. The National Academies of Science, Engineering and Medicine, in a report dated April 7th, addressed two issues: the survival of SARS-CoV-2 in relation to temperature and humidity and the potential for a seasonal reduction and resurgence of cases. After reviewing all of the existing literature, they essentially concluded that if there is an effect of temperature and humidity on transmission, that it may not be as apparent as with other respiratory viruses; they also concluded that, based upon 10 influenza pandemics in the past 250 years, some started in the winter, some in the spring, some in the summer and some in the fall. Most alarmingly, they also stated that all had peak second waves six months after emergence of the virus in the human population, regardless of when the initial introduction occurred. Thus, the hope that when the warm weather comes, we will see a marked decrease in cases is highly unlikely. In two very recent articles and communications in the Lancet, the likelihood of a “second wave” of cases occurring in China, and any country, are directly linked to how travel restrictions, social distancing and other interventions are “relaxed” (face masks, contact tracing, surveillance, temperature checks).The risk of re-introduction of the virus into the population from overseas importation is and will be a substantial risk. Finally, there is a third factor to consider. Something that we use in epidemiology and that you likely have heard about, R0 – the basic reproduction number; a value that tells us how many other people are likely to become infected from someone who currently is infected. For SARS-CoV-2, this number has wavered between 2 to 2.5. A recent analysis of the data from China has placed this number closer to 5.7. The U.S. data currently ranges at about 2.5. Why is this important? If we consider the concept of “herd immunity” – what percent of the population needs to have immunity to a disease in order to “protect” those that don’t from getting it. The R0 is important, because we use that in the formula to come up with the percent of herd immunity needed. For a R0 of 2.2, 55% of the population needs to have immunity; for a R0 of 5, 80% of the population needs to have immunity. So, if we get over the hump and the appearance of new cases significantly decreases, can we return to ballgames, group gatherings, and large intermingling of people? For those who had COVID-19 and survived, the answer is “Yes”. For those who didn’t contract the disease, the answer is “No”. You see, that unless at least 50-80% of the population has had the disease and recovered, those who haven’t are still at risk, and they most likely are those that were at highest risk of having severe, life-threatening cases. The only solution will be a vaccine that will protect at least 80% or more of those who receive it from developing the disease. That, unfortunately, is not on the horizon for quite a while. If we look at flu shots, we have rarely had an efficacy that has even closely approached this number. Thus, what we can expect as the new “norm” will be for people at high risk for a severe outcome (those with marked obesity, hypertension, diabetes, metabolic diseases, chronic lung disease [including asthma], cardiovascular disease , over the age of 60, and neurological disorders) to continue to avoid large social gatherings, continue social distancing and frequent handwashing- and probably face mask continued use. If we let up too quickly on the measures we’ve taken, including international travel, we could very well see a “second wave” of SARS-CoV-2 infections. One of the problems is that the SARS-CoV-2 virus is not simultaneously affecting every country in the world. Peaks have not yet been reached in many countries, and in some, it has not yet begun. So, we could very well see this virus burning throughout the world for quite a while. The threat of a second wave could only be an airline flight away! So, in conclusion, what will the new “norm” look like? Nothing like what the old “norm” used to be. If you should develop any of the symptoms of COVID-19 (cough, fever/chills/,shortness of breath, muscle aches, diarrhea, nausea& vomiting, sore throat, headache or loss of smell or taste) and are high-risk for complications, you need to contact your healthcare provider- no matter how mild the symptoms may be! Well, now that we have your attention, let us talk about something simple that may reduce your chances of contracting the Coronavirus as well as the Flu and many other diseases. Simple handwashing is one of the keys, but as in the case of many techniques, it must be done properly in order to work. But first, let’s step back a little and answer the question “What do my hands have to do with a respiratory virus?” The primary mode of contracting most respiratory viruses is by coming into contact with the viral particles that have been expelled into the air by means of a cough, or a sneeze. Based upon studies looking at college students with the flu, it was found that many infected people released viral particles into the air by merely exhaling their breath or when speaking. This also looks as if it may apply to the coronavirus as well. However, in addition to encountering airborne particles, our mucous membranes can also come into contact with infectious pathogens by being touched with a finger or hand that has picked them up from a contaminated surface. Some medical authorities believe that more influenza is spread by this means rather than the airborne route- I would agree. Based upon a study I have often quoted, it would appear that we touch our faces an average of 23 times/hour and that nearly half of those times (44%), it is a mucous membrane area! Alarmingly, 36% of the time, they touched their mouths, 31% of the time their noses, and 27% of the time, their eyes. Although this study looked at medical students (a group that should appreciate the dangers of frequent face-touching) one can imagine that for others, the number of times/hours is likely greater. So, you can see why hand washing is so important, because it is the route to getting something from a surface you’ve touched into your body! Let’s look at why soap removes bacteria and viruses more effectively than does water alone. Soap consists of molecules that both bind with water and also bind to fats. In the case of viruses that are surrounded by a lipid (fatty) envelope (like the Corona viruses and Influenza A, for instance) when attaching to the virus, soaps disrupt this envelope; essentially poking holes in its defenses. In addition to disrupting the fatty layer of the virus, soap molecules also form around the virus or other agent and help to suspend it in the water, so that these agents rinse off much more easily. The explanations I just gave is somewhat simplistic. For a more detailed explanation, I refer you to a more detailed article in the New York Times . Now that we have established the importance of handwashing, how do we effectively do it? More likely than not, most of us have been doing it wrong. The keys are for at least 20 seconds, lathering up well, and something I would add, making sure you rub the tips of your thumbs into your palms in a circular motion (they are often neglected!). Please take a look at this excerpt from the CDC’s handwashing site. It is important to follow these five steps every time you wash your hands: 1. Wet your hands with clean, running water (warm or cold), turn off the tap, and apply soap. 2. Lather your hands by rubbing them together with the soap. Lather the backs of your hands, between your fingers, and under your nails. 3. Scrub your hands for at least 20 seconds. Need a timer? Hum the “Happy Birthday” song from beginning to end twice. 4. Rinse your hands well under clean, running water. 5. Dry your hands using a clean towel or air dry them. In addition to keeping social distancing, staying home unless it’s absolutely necessary to go out, you need to wash your hands (to quote the CDC), “After you have been in a public place and touched an item or surface that may be frequently touched by other people, such as door handles, tables, gas pumps, shopping carts, or electronic cashier registers/screens, etc.” There is so much information, misinformation and, at times, confusing information about COVID-19. For instance, the name of the disease is COVID-19, but it is caused by the newly circulating Coronavirus known as SARS-CoV-2. The virus has the first part of its name as “SARS” but is different from the virus that causes the disease SARS! Many people, including experts, use the names interchangeably, but they are not. It seems as if we can’t agree on something so simple, so how about things more complex? Well, enough about that; you get the point that it is understandable why people get confused. The focus of this posting will be to share with you what I believe are highly reliable sites to get your information from, as well as to try to explain three things you are hearing a lot about that seem to be confusing, but are important: 1.the death rate (known as the crude case-fatality rate) of COVID-19 2.the expression” flattening the curve” (what it is and why it’s so important) 3.why there will not be a vaccine available in a matter of months You likely have heard a wide array of figures being given as to what the death rate appears to be from COVID-19. When one hears different numbers being given, the tendency is to think that no one seems to know what they are talking about. The reality is that there is not any one mortality rate for the disease. The value being given by U.S. health authorities is ~1%, but, based on current information, seems more like 2%, and the number that the World Health Organization has given has been closer to 3.4% and China has published a rate of 2.3%. Why the discrepancy? Well, they are talking about different populations and some are blended numbers. Confused? Let me explain. In epidemiology the mortality rate (often referred to as the crude case-fatality rate [CFR]) is actually a simple calculation: the number of fatal cases divided by the total number of cases (total number of fatal cases ÷ total number of cases). The result can be very misleading, however. If we look at the Chinese data and stratify it (arrange it by different groups) we see why there is such a great concern about this disease. In China, people older than age 80 had a CFR of 14.8%; those aged 70-79 years old had a CFR of 8%; those who had a critical case (~5% of the people infected) had a CFR of 49%! All of these numbers are true, but specific to the population group being looked at. Yet, when you hear experts speak, they don’t always clarify what group they are talking about. There are currently 22.6 million American age 70-79 and 12.6 million aged 80 or older. We also know that people older than age 60 and especially with co-existing diseases are at a higher risk of having severe to critical disease when infected. That is one reason why we are concerned about a disease in which “80% have a mild case”. If you’re young and healthy that applies to you, but not the 33 million Americans who are in the higher risk group. If you haven’t thought about it already, you can see that calculation of an accurate case fatality rate is completely dependent on knowing how many cases there are within the population- be they diagnosed and undiagnosed. With the current lack of surveillance (identifying how many cases there are in the population versus how many are sick enough to meet the present criterion for testing), we really don’t know how many people are or have been infected. Without this knowledge, we can’t take the needed steps to limit the spread, because we don’t know how widespread it really is. A good analogy is that we are asking a color-blind person to tell us how many redheads there are in the room! This leads into the next concept to explain- “flattening the curve”. In epidemiology we look at disease curves to guide our interventions and understandings of a disease. It is a simple graph; the number of cases over time (days, weeks, dates, etc.). It has been predicted that as the number of cases rise (especially if it is a sudden and dramatic one), the capacity of the healthcare system to deal with them (hospital admissions, ICU beds, respirators, etc.) could easily be overwhelmed; leading to a situation as is now seen in Italy, where difficult decisions as to whom to treat and not treat are being made. If we can take measures to slow down the spread such as social distancing (cancelling large gatherings, working from home, avoiding crowded areas, and, in some instances, closing schools) as well as common sense measures such as staying home when sick, hand washing and frequent cleaning of surfaces in public areas, we can decrease the number of cases over a given time and “flatten the curve out”. So, any changes that delay the rapidity of the spread, and the number of cases in a given period of time, can help to prevent the healthcare system from being overwhelmed as susceptible and high-risk people become infected. This whole concept was graphically illustrated in a March 11 article by Helen Branswell in Statnews.com . The illustration shows that as we slow down the spread and hence, the number of cases in a given time period, the healthcare system would not be as overwhelmed as it could be. Finally, let’s look at why there will not be a vaccine in a few months or even within the next six or nine months. This is because there is a very important sequence of events that must take place once a suitable vaccine candidate is found. It must first be demonstrated to be safe and effective in preventing the disease from developing; typically, in an animal model (animal testing in a mammal whose immune system is similar to ours). There are then 3 phases of studies: a small group of people who get the vaccine and are observed for side effects or major adverse reactions and followed over a period of time to identify late effects; a larger group to see if any of the concerns arise; then a larger group who may more closely mimic the population to be vaccinated (if the vaccine is still found to be safe). Finally, if all 3 human phases show no major issues, then adequate doses of the vaccine are produced. So, you can see that getting a safe vaccine out to the public is not an easy nor quick process. Finally, in closing, I have listed some websites where you can get up-to-date and accurate, information about COVID-19: MA Department of Public Health Johns Hopkins Center for Health Security CDC Coronavirus info page CDC Travelers Coronavirus info page NIH Coronavirus info page American Academy of Family Physicians Coronavirus webpage For those interested in real-time mapping and seeing where the cases are: Johns Hopkins COVID-19 Real-time Mapping University of Virgina COVID-19 real-time mapping This is “Part 2” in my winter series. As you may recall in “Part 1” I spoke about the factors that affect how our bodies lose heat as well as hypothermia and frostbite. In this issue I will talk about Carbon monoxide and share some extreme cold weather tips from the Massachusetts Emergency Management Agency. Carbon Monoxide (referred to as CO) is an odorless, colorless gas that is found in combustion fumes from any device that is producing a flame; this becomes a problem when it does so in an enclosed or partially-enclosed area. Stoves, gasoline-powered engines, generators, wood-burning stoves and even gas ranges can produce carbon monoxide gas. Exposure to high concentrations of this gas can cause very serious and sudden symptoms that can rapidly progress to death – if exposure continues. The main mechanism by which CO causes problems and poisoning is that CO binds to red blood cells more quickly and avidly than does oxygen. As a result, there is less opportunity for oxygen to bind to the red blood cells. As the concentration of oxygen in the bloodstream is lowered, cells can become injured and, in the case of severe CO poisoning, die. Early symptoms of CO exposure and poisoning are typically the onset of a headache, sometimes dizziness, weakness, nausea and vomiting, and a quick progression to confusion. In some instances, a person may even experience chest pain- particularly if they have pre-existing heart or lung disease. One of the problems with CO exposure is that if a person is sleeping, has been drinking alcohol or using other substances that can alter awareness, they can die from CO poisoning before they ever experience any symptoms! Any family where everyone suddenly has the simultaneous, rapid onset of symptoms that seems like the flu should be highly suspicious for CO exposure. If CO poisoning is suspected, one needs to be evaluated right away. The environment they were in needs to be ventilated as soon as possible - by professionals who can test for and deal with CO build-up. In most situations, this means the local fire department. Some fortunate people are very sensitive to CO and experience mild symptoms at very low concentrations. An example would be getting a headache while in heavy, stop-and-go traffic on a hot day or getting a headache while driving stop-and-go in a long underground tunnel. So, the logical question is “How do I prevent CO poisoning?” The first and foremost way is to make sure a CO detector is installed (and properly functioning!) in your house/apartment. In the case of a power outage, never, and I repeat, never use a gas range or open oven to heat your apartment/house! If you have a garage attached to your home, never leave the car running or idling in it, since CO can “seep” into your home. You should never run a generator or any gasoline-powered device in a garage, under a window, near a door or anywhere where the exhaust gases can enter into a home. Make sure that you use a device that specifically states it is approved for use inside a home before using it as a supplemental source of heat. If you do lose power, don’t use a fireplace that hasn’t been used in years, or has not been properly inspected and cleaned. These rules also apply to a car; don’t sit in a parked car with the heater running for a prolonged period of time. You should also have your vehicle’s exhaust system checked in the fall to make sure there are no leaks (we tend to keep windows closed in the winter rather than in the warmer seasons). Just a small leak in an exhaust system can cause CO gas to build up in a stationary vehicle. Finally, we would like to pass on the following cold weather safety tips from the Massachusetts Emergency Management Agency (MEMA):
So, in closing, I would like to remind you to use common sense, be safe, take care and enjoy the winter season. But, above all, respect the strength and unpredictability of Mother Nature. |